Friday 21 December 2012

Seasons Greetings


Dear Colleagues, friends and comrades,
 
On behalf of Tax Justice Network-Africa Secretariat, the Board of 
Directors and the entire membership, I would like to take this 
opportunity to thank you for your continued support and collaboration in furthering the cause of tax justice in Africa.

TJN-A would like to wish you all a Merry Christmas and a prosperous 2013.  
Please note that our offices remain closed till 7th of January.

Best Regards 
Alvin Mosioma- Director. 
Tax Justice Network- Africa 

Tuesday 18 December 2012

What Billions In Illicit And Licit Capital Flight Means For The People Of Zambia


What Billions In Illicit And Licit Capital Flight Means For The People Of Zambia

December 13, 2012

By Sarah Freitas

Sarah Freitas is an Economist at Global Financial Integrity in Washington, DC and a co-author of "Illicit Financial Flows from Developing Countries over the Decade Ending 2009," a December 2011 report from GFI. 
A forthcoming report by Global Financial Integrity finds that Zambia lost US$8.8 billion in illicit financial outflows from 2001-2010
flickr / photosmith2011
In our newest report, Illicit Financial Flows from Developing Countries 2001-2010, we look at illicit financial flows–the proceeds of crime, corruption, and tax evasion–leaving the developing world. Illicit financial flows are a type of capital flight, and have been a persistent plague on the developing world for some time now. Our new report will be released on Tuesday morning. But for today, I want to focus more narrowly on Zambia, one of the poorest nations on earth and one of the clearest examples of the damage caused by both illicit and licit capital flight.
Our research finds that $8.8 billion left Zambia in illicit financial flows between 2001 and 2010. Of that, $4.9 billion can be attributed to trade misinvoicing, which is a type of trade fraud used by commercial importers and exporters around the world.
This is a very serious problem. Zambia’s GDP was $19.2 billion in 2011. Its per-capita GDP was $1,413. Its government collected a total of $4.3 billion in revenue. It can’t afford to be hemorrhaging illicit capital in such staggering amounts.
In previous reports, we’ve proven that illicit financial flows drive the underground economy. This means that as criminals and tax evaders avoid law enforcement and move their money overseas, it becomes easier for them to operate in Zambia. The underground economy becomes bigger, which makes it even more difficult for Zambia’s government to collect taxes. This in turn drives illicit financial flows further, completing the vicious feedback loop.
These illicit outflows come on top of tremendous outflows from legal corporate tax avoidance. $2 billion is lost yearly to tax avoidance by multinational corporations operating in Zambia, according to Zambian Deputy Finance Minister Miles Sampa. Most of this tax avoidance is due to abusive transfer pricing–which is a type of quasi-legal trade misinvoicing–in the mining sector. According to Minister Sampa, of all the major multinationals that export record amounts of copper and other metals out of Zambia, just “one or two” officially recorded a profit, and therefore pay no corporate tax. A new law to close corporate tax avoidance loopholes is estimated to raise $1.5 billion per year. Minister Sampa asks, “How many hospitals can that build? How many roads can that help us develop?”
The type of tax avoidance that Minister Sampa is referring to will not be picked up by our illicit financial flow estimates, both because the activity is not explicitly illicit and because it occurs between two branches of a multinational corporation, and therefore isn’t reflected in the IMF Direction of Trade statistics that we use to calculate illicit financial flows.
Tax revenue loss from capital flight means less to spend on not only education and transportation infrastructure, but also on fighting HIV/AIDS, providing clean water, and generally building up society. It means more money has to be borrowed from abroad, and it strains aid budgets. If Zambia were to collect an extra $2 billion per year in revenue from curtailing both illicit financial flows and legal tax avoidance, they could increase their government’s budget by 46%.
But on top of the tax revenue lost, the Zambian people need Zambian wealth to stay in Zambia. When a mining company moves money out of the country instead of paying corporate tax on earnings, it drains much-needed capital from the economy. Money that stays in the country will provide a compounding boost to the Zambian economy every single year, as it will be invested in the private sector.
Zambia has the natural resource wealth to dig (literally and figuratively) its way out of poverty, but only if the West acts at the same time. Zambia can’t do this alone. The extra money could be siphoned off to the offshore bank accounts of corrupt public officials, or companies could find new ways to legally pretend that their profits were made elsewhere. The global shadow financial system–a network of secrecy laws, tax havens, shell corporations, and banks like HSBC without real money laundering controls–facilitates both illicit financial flows and pernicious corporate tax avoidance. We need to break this system down. We can start by reforming international customs and trade protocolsto detect and curtail trade misinvoicing and requiring the country-by-country reporting of sales, profits and taxes paid by multinational companies.
Editorial Note: On Tuesday, December 18th, Global Financial Integrity will release its new report, Illicit Financial Flows from Developing Countries 2001-2010, measuring illicit financial flows out of 150 different developing countries. Sign up here to receive notices when new GFI reports are released.http://www.financialtaskforce.org/2012/12/13/what-billions-in-illicit-and-licit-capital-flight-means-for-the-people-of-zambia/

GFI New Report Finds Crime, Corruption, and Tax Evasion at Near-Historic Highs in 2010

New Report Finds Crime, Corruption, and Tax Evasion at Near-Historic Highs in 2010
Illicit Financial Outflows Cost Developing World $859 Billion in 2010, Rebounding Rapidly from Financial Crisis

Nearly $6 Trillion Stolen from Poor Countries in Decade between 2001 and 2010

WASHINGTON, DC – Crime, corruption, and tax evasion cost the developing world $858.8 billion in 2010, just below the all-time high of $871.3 billion set in 2008—the year preceding the global financial crisis.  The findings are part of a new study released today by Global Financial Integrity (GFI), a Washington-based research and advocacy organization.

The report, “Illicit Financial Flows from Developing Countries: 2001-2010,” is GFI’s annual update on the amount of money flowing out of developing economies via crime, corruption and tax evasion, and it is the first of GFI’s reports to include data for the year 2010.

Co-authored by GFI Lead Economist Dev Kar and GFI Economist Sarah Freitas, the study is the first by GFI to incorporate a new, more conservative, estimate of illicit financial flows, facilitating comparisons with previous estimates from GFI updates.

“Astronomical sums of dirty money continue to flow out of the developing world and into offshore tax havens and developed country banks,” said GFI Director Raymond Baker.  “Regardless of the methodology, it’s clear: developing economies are hemorrhaging more and more money at a time when rich and poor nations alike are struggling to spur economic growth. This report should be a wake-up call to world leaders that more must be done to address these harmful outflows.”

Methodology

As developing countries begin to loosen capital controls, the possibility exists that the methodology utilized in previous GFI reports—known as the World Bank Residual Plus Trade Mispricing method—could increasingly pick-up some licit capital flows.  The methodology introduced in this report— the Hot Money Narrow Plus Trade Mispricing method—ensures that all flow estimates are strictly illicit moving forward, but may omit some illicit financial flows detected in the previous methodology.

“The estimates provided by either methodology are still likely to be extremely conservative as they do not include trade mispricing in services, same-invoice trade mispricing, hawala transactions, and dealings conducted in bulk cash,” explained Dr. Kar, who previously served as a senior economist at the International Monetary Fund.  “This means that much of the proceeds of drug trafficking, human smuggling, and other criminal activities, which are often settled in cash, are not included in these estimates.”

Findings

The $858.8 billion of illicit outflows lost in 2010 is a significant uptick from 2009, which saw developing countries lose $776.0 billion under the new methodology.  The study estimates the developing world lost a total of $5.86 trillion over the decade spanning 2001 through 2010.1

“This has very big consequences for developing economies,” explained Ms. Freitas, a co-author of the report.  “Poor countries lost nearly a trillion dollars that could have been used to invest in healthcare, education, and infrastructure.  It’s nearly a trillion dollars that could have been used to pull people out of poverty and save lives.”

Dr. Kar and Ms. Freitas’ research tracks the amount of illegal capital flowing out of 150 different developing countries over the 10-year period from 2001 through 2010, and it ranks the countries by magnitude of illicit outflows. According to the report, the 20 biggest exporters of illicit financial flows over the decade are:

  1. China ....................... $274 billion average ($2.74 trillion cumulative)
  2. Mexico ..................................... $47.6 billion avg. ($476 billion cum.)
  3. Malaysia .................................. $28.5 billion avg. ($285 billion cum.)
  4. Saudi Arabia ........................... $21.0 billion avg.  ($210 billion cum.)
  5. Russia ....................................... $15.2 billion avg. ($152 billion cum.)
  6. Philippines ............................... $13.8 billion avg. ($138 billion cum.)
  7. Nigeria ...................................... $12.9 billion avg. ($129 billion cum.)
  8. India ......................................... $12.3 billion avg. ($123 billion cum.)
  9. Indonesia ................................. $10.9 billion avg. ($109 billion cum.)
  10. United Arab Emirates .............. $10.7 billion avg. ($107 billion cum.)
  11. Iraq ......................................... $10.6 billion avg. ($63.6 billion cum.)2
  12. South Africa ........................... $8.39 billion avg. ($83.9 billion cum.)
  13. Thailand ................................. $6.43 billion avg. ($64.3 billion cum.)
  14. Costa Rica ............................... $6.37 billion avg. ($63.7 billion cum.)
  15. Qatar ........................................ $5.61 billion avg. ($56.1 billion cum.)
  16. Serbia ....................................... $5.14 billion avg. ($51.4 billion cum.)
  17. Poland .................................... $4.08 billion avg. ($40.8 billion cum.)
  18. Panama ................................... $3.99 billion avg. ($39.9 billion cum.)
  19. Venezuela ................................ $3.79 billion avg. ($37.9 billion cum.)
  20. Brunei ..................................... $3.70 billion avg. ($37.0 billion cum.)

For a complete ranking of average annual illicit financial outflows by country, please refer to Table 2 of the report’s appendix on page 36, or download the rankings by average annual illicit outflows here [PDF | 51 KB].

Also revealed are the top exporters of illegal capital in 2010, which were:

  1. China ..................................................... $420.36 billion
  2. Malaysia .................................................. $64.38 billion
  3. Mexico ...................................................... $51.17 billion
  4. Russia ...................................................... $43.64 billion
  5. Saudi Arabia ............................................ $38.30 billion
  6. Iraq........................................................... $22.21 billion
  7. Nigeria ..................................................... $19.66 billion
  8. Costa Rica.................................................. $17.51 billion
  9. Philippines ............................................... $16.62 billion
  10. Thailand.................................................... $12.37 billion
  11. Qatar ........................................................ $12.36 billion
  12. Poland ...................................................... $10.46 billion
  13. Sudan ......................................................... $8.58 billion
  14. United Arab Emirates ................................ $7.60 billion
  15. Ethiopia ..................................................... $5.64 billion
  16. Panama ...................................................... $5.34 billion
  17. Indonesia .................................................... $5.21 billion
  18. Dominican Republic ................................... $5.03 billion
  19. Trinidad and Tobago .................................. $4.33 billion
  20. Brazil ........................................................... $4.29 billion

An alphabetical listing of illicit financial outflows is available for each country in Table 9 on pg. 62 of the report.  You can also download the alphabetical listing of illicit financial flows data for each country here [PDF | 64 KB].

Connections to Previous GFI Studies

China, the largest cumulative exporter of illegal capital flight, as well as the largest victim in 2010, was the topic of an October 2012 country-specific report by GFI’s Kar and Freitas.  Using the older methodology, “Illicit Financial Flows from China and the Role of Trade Misinvoicing,” found that the Chinese economy suffered $3.79 trillion in illicit financial outflows between 2000 and 2011.

“Our reports continue to demonstrate that the Chinese economy is a ticking time bomb,” said Dr. Kar. “The social, political, and economic order in that country is not sustainable in the long-run given such massive illicit outflows.”

Mexico, the second-largest cumulative exporter of illicit capital over the decade, was also the topic of a January 2011 GFI report by Dr. Kar.  The study, “Mexico: Illicit Financial Flows, Macroeconomic Imbalances, and the Underground Economy,” found that Mexico lost a total of $872 billion in illicit financial flows over the 41-year period from 1970 to 2010.  Moreover, illicit outflows were found to drive Mexico’s domestic underground economy, which includes—among other things—drug smuggling, arms trafficking and human trafficking.

Possible Solutions

Global Financial Integrity advocates that world leaders increase the transparency in the international financial system as a means to curtail the illicit flow of money highlighted by Dr. Kar and Ms. Freitas’ research.  Policies advocated by GFI include:

  • Addressing the problems posed by anonymous shell companies, foundations, and trusts by requiring confirmation of beneficial ownership in all banking and securities accounts, and demanding that information on the true, human owner of all corporations, trusts, and foundations be disclosed upon formation and be available to law enforcement;
  • Reforming customs and trade protocols to detect and curtail trade mispricing;
  • Requiring the country-by-country reporting of sales, profits and taxes paid by multinational corporations;
  • Requiring the automatic cross-border exchange of tax information on personal and business accounts;
  • Harmonizing predicate offenses under anti-money laundering laws across all Financial Action Task Force cooperating countries; and
  • Ensuring that the anti-money laundering regulations already on the books are strongly enforced.

Funding

Funding for the new report, “Illicit Financial Flows from Developing Countries: 2001-2010,” was generously provided by the Ford Foundation.

To schedule an interview with GFI spokespersons on this report, contact Clark Gascoigne at  +1 202 293 0740, ext. 222 or cgascoigne@gfintegrity.org. On-camera spokespersons are available in Washington, DC.

###

Footnotes:

  1. The less conservative, methodology used in previous GFI updates measured $936.1 billion in 2009.  Were the previous methodology applied to 2010, it would have measured $1.138 trillion in illicit outflows from the developing world, a 26 percent increase over the previous year.  Table 11 on pg. 70 provides a breakdown of illicit financial flow estimates for each country based on the original methodology.
  2. Data for Iraq was not available in 2001-2004, thus the average illicit outflows of US$10.6 billion reflect only the years 2005-2010.  Likewise, the cumulative outflows of US$63.6 billion for Iraq are cumulative outflows for 2005 through 2010 only.

Notes to Editors:

  • More information about the GFI report is available on the GFI website here.  A PDF of the full report can be downloaded here [PDF | 3.3 MB].  An “Explore” page, complete with an interactive heat-map, and .zip files of the report’s data is available here.
  • A tip-sheet for journalists can be downloaded here [PDF | 222 KB].
  • A PDF with full country rankings by average annual illicit financial outflows is available here [PDF | 51 KB].
  • An alphabetical listing of total illicit financial flows data for each country each year is available here [PDF | 64 KB].
  • A separate press release for Indian journalists is available here.
  • All monetary values are listed in US dollars (USD).

Contact:

Clark Gascoigne
cgascoigne@gfintegrity.org
 +1 202 293 0740, ext. 222

EJ Fagan
efagan@gfintegrity.org
 +1 202 293 0740, ext. 227

_______________________________

Global Financial Integrity (GFI) is a Washington, DC-based research and advocacy organization which promotes transparency in the international financial system.

For additional information please visit www.gfintegrity.org.

Follow us on: Twitter | Facebook | YouTube

Monday 17 December 2012

Spend or Send


Spend or Send

FINANCE & DEVELOPMENT, December 2012, Vol. 49, No. 4
Developing countries can spend commodity windfalls on physical investment, but it may be better in the short run to distribute part of them to their citizens
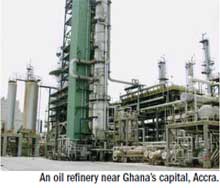
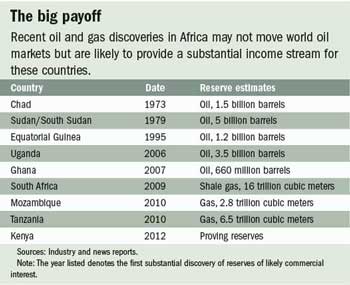
THE decade-long boom in commodity prices has boosted government coffers in many traditional producing countries. Following a wave of discoveries, new oil and gas producers—such as Ghana, Mozambique, Tanzania, and Uganda—are also emerging (see table). They may not all be major players at the global level, but the revenues they raise will be substantial for them and will brighten the prospects for growth and poverty reduction.
Still, the future is not without its dark side. New oil income will almost certainly relax constraints on government budgets, but it will also create challenges—as conditions in other resource-rich countries show. Many citizens of these countries remain poor, despite large revenues from resources. In some cases competition over resource wealth
The big payoffhas fueled or sustained civil conflict. Economic diversification is a further long-run challenge: nonresource sectors tend to lose competitiveness as a result of exchange rate appreciation.
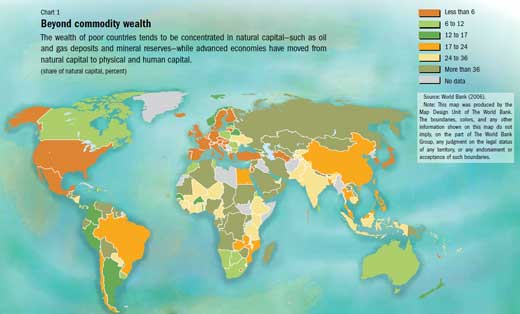
All of these effects have been seen, for example, in Nigeria in past years. The long-run issues surrounding development become starker in light of the need to rebalance economies by fostering non-commodity-based industries to produce higher-value-added goods and provide a livelihood for people after commodity reserves are depleted. Advanced economies have moved away from natural capital—such as oil and gas deposits and mineral reserves—to physical and human capital (see Chart 1). But the wealth of poor countries tends to be concentrated in natural resources.
Click to enlarge the chart
The traditional argument is that countries should use their resource revenues to finance public investment. But there are questions about whether this is always the best approach. The limited state capacity of many resource-based countries makes appropriate and effective investment difficult to achieve. Limited capacity reflects not only a government’s lack of technical ability to identify, implement, and monitor key investment projects. It is often also the result of public sector corruption that allows those with clout to misspend and misallocate the resource windfall, including through high-value construction contracts that are especially susceptible to mismanagement. As a result, in some cases sharply scaled-up public investment may be the wrong way to go. It may be more effective in the short run to distribute some of the windfall as a direct dividend to citizens and rely on their spending choices to create and foster nonresource industries. In the medium and long run, countries should beef up their governing capacity—investing in investment capacity, so to speak—to relax some of the constraints on the use of revenues.

Avoiding past mistakes

During the booms of the 1970s, many traditional commodity exporters embarked on ambitious, but often wasteful, public spending—including on infrastructure such as roads, ports, and railroads. Case studies document investment projects that were plagued by inefficiency and also contributed to resource misallocation (Gelb, 1988). Even when completed, large projects sometimes failed to provide benefits because governments were unable to cover the high costs of operating and maintaining them.
Commodity windfalls, because they move directly through government coffers, offer public officials ample opportunity to divert them for personal gain. Manipulation of public spending, especially in the letting of construction contracts, is a major impediment to the successful use of windfalls. A study of 30 oil-exporting countries for the period 1992–2005 shows that large oil windfalls cause a significant increase in corruption (Arezki and Brückner, 2012); this both raises the cost of public investment and reduces its quality. An index of the quality of public investment management produced by the IMF shows markedly lower quality in resource-exporting countries (Kyobe and others, 2011). In addition, spending booms triggered by oil revenues have often overshot available resources and led producing countries, especially those with weak institutions, to fall into debt (Arezki and Brückner, 2011).
Click to view the larger chart
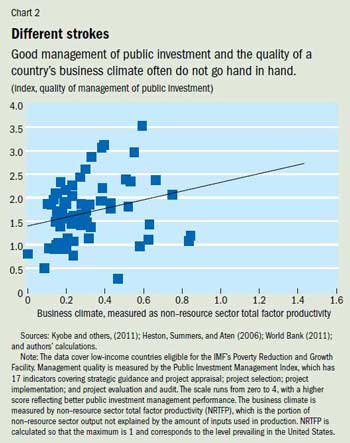
To avoid such problems, commodity producers must take into account their institutional conditions when determining the long-term level and type of spending following a commodity windfall. We can model optimal spending decisions for countries with weak governing capacity by assuming that there are inefficiencies—due to poor governance and public institutions—that make the costs of public investment exceed its face value, and we can assume that those costs increase with the size of the commodity windfall. We can also consider the implications of a better or worse investment climate faced by private businesses, which will affect how strongly private investment responds to the opportunities created by public infrastructure spending. Different countries face different combinations of these two institutional conditions (see Chart 2). Some may have a relatively strong public administration but a poor business climate (for example, Algeria), while others with relatively low scores on perceived quality of state institutions manage to sustain quite an efficient private sector (for example, Kenya). We also consider an alternative to public spending: the direct transfer of windfall resource revenues to citizens to supplement their wage income and raise their opportunity to invest and consume.

Citizen gain

The direct transfer of resource windfalls to citizens has been done. The U.S. state of Alaska and the Canadian province of Alberta send their citizens a yearly payment based on oil revenue. Each Alaska resident, for example, received a dividend of about $1,300 in 2009 (Ross, forthcoming). Mongolia distributes part of its mining revenues to its citizens and has recently pledged to endow each Mongolian with a portfolio of dividend-yielding preference mining shares. One argument for citizen dividends draws on evidence that taxation has historically been central to the creation of effective modern states: by distributing resource revenues and then taxing back part of them governments improve public accountability because citizens are more inclined to monitor the use of public funds (Sala-i-Martin and Subramanian, 2003; Moss, 2011). More direct arguments relate to the observed inefficiency in public spending, especially as programs are scaled up, and the frequent failure of ordinary people to benefit from the scaled-up public spending programs. Still more immediate arguments relate to increasing evidence of the development impact of cash transfers and the possibility of making them effectively.
Social transfers work and are one of the most effective—and evaluated—mechanisms of development assistance, especially when those transfers are conditioned on actions by recipients—such as keeping children in school. Many studies document how such transfers help households reduce poverty and improve children’s growth indicators, encourage school attendance, and improve access to health services. There is also little evidence that transfers to poor people discourage people from working. On the contrary, recipients seem to use the money to search for jobs. Moreover, transfers appear to encourage productive household activity. Poor households are less constrained by the deficient credit and insurance markets that characterize less developed economies. Small but reliable flows of transfers have helped poor households accumulate private productive assets, avoid distress sales in bad times, obtain access to credit on better terms, and diversify into higher-risk and higher-return activities. There is also some evidence that the introduction of transfers into poor remote areas can stimulate demand and local market development. Transfers are increasingly being integrated into social protection programs. Evidence from many social programs suggests that resource-generated transfers can help both recipient households and the country.
Not long ago, it would have been difficult, if not impossible, to send a windfall dividend to citizens in poorer countries without much of it being lost or appropriated by corrupt civil servants. But new technology has opened up ways to transfer funds accurately and efficiently to households—and at low cost. Cellular phones and biometric smartcards are increasingly being used, even in countries with poor institutions and low capacity. For example, Pakistan’s Watan Card program delivered reconstruction support to more than 1.5 million flood-affected households. South Africa’s system of social grants effectively uses this technology, as does a program to support demobilized militias in the Democratic Republic of the Congo. Biometric technology can overcome traditional difficulties in identifying recipients, preventing multiple payments, and eliminating “ghost” recipients. Gelb and Decker (2012) consider 19 programs. Not all programs have been comprehensively evaluated, but the evidence indicates that they can be implemented on a large scale with nearly all funds going for their intended use (“little leakage,” in economic parlance), using identification and payment technologies that provide benefits beyond the transfer program itself—such as access to a bank account for precautionary savings and fuller and accurate electoral rolls. Because these technologies can minimize the costs of distributing an oil dividend uniformly across the population, it is reasonable to assume that policymakers can use part of a commodity windfall to provide direct transfers at essentially zero cost.

What to do

Considering all these elements in a model of optimal windfall use leads to a number of conclusions that can help guide policy. All decisions should of course be made in a long-run context that encourages saving when resource income is high to enable spending to continue when that income is low. But beyond these considerations, institutional features shape how the windfall could best be used. Weaker public administrative capacity reduces the optimal level of public investment in favor of larger transfers to citizens: it is better to give private households part of the funds directly than to waste them on ineffective spending. Moreover, all else equal, a larger commodity windfall should induce lower rather than higher public investment, because the behavior of officials seeking to appropriate the windfall further weakens the country’s capacity. These conditions bolster the argument for transfers to citizens.
The underlying business climate also plays a role in determining the optimal use of resource revenues. Good conditions—such as security and stable pro-business regulations that encourage the private sector—may compensate for weak capacity and justify higher public investment. This is because public investment spending is likely to encourage more productive private investment, which in effect raises the return on the public investment. Government capacity may affect the business climate, but good governance and a good business climate do not always go hand in hand, as we show in our examples above. Commodity-producing governments and their strategic economic advisors must take these institutional factors into account when determining how to use their revenues.

Investing in investing

Limited government capacity is a constraint, but not necessarily a fixed one. Some countries—Chile, for example—have strengthened their capacity; others have arguably weakened it. A windfall might well be spent in part on improving a country’s capacity to manage its investment program and provide the key public goods and services—such as effective roads, power supply, and regulation—the private sector needs to thrive. To explore such a possibility we extended our basic model by introducing the possibility of reducing the adjustment cost in public investment over time—at a price. We found that optimal public investment increases over time, with reliance on transfers diminishing as ever-increasing public capital attracts more private capital and produces more wage income. In general, the better the business climate, the stronger the arguments for this strategy. There is less point in boosting public investment if it then fails to stimulate private investment to produce valuable output. More research is needed on modeling state capacity, ways to invest in that capacity, and the time frames for such improvement.
To combat corruption, commodity exporters could ensure better transparency in the handling of windfalls. For instance, the Extractive Industries Transparency Initiative provides a global standard for transparency in the oil, gas, and mining industries, while the Natural Resource Charter, which builds on the transparency initiative, offers more comprehensive principles for governments and societies on how to best harness the opportunities for development generated by extractive commodity windfalls. Those initiatives can serve as anchors for enhancing transparency and accountability in commodity-rich countries. More specifically, open publication of public procurement contracts can help improve investment quality and reduce contract costs and cost overruns (Kenny and Karver, 2012).
Countries can also boost their technical ability to identify and implement projects. An example is Chile, which for three decades has subjected all public projects to disciplined and transparent cost-benefit analysis. The South American nation standardized the approach to evaluating a project and separated the institution that evaluates a project from the one proposing it. The National System of Investments is based at the Ministry of Planning and is administered jointly with the Ministry of Finance. A combination of efforts to increase technical capacity and eradicate corruption is the best way to harness the power of commodity windfalls in developing countries. ­■
Rabah Arezki is an Economist in the IMF Institute for Capacity Development, Arnaud Dupuy is Professor of Economics at the Reims Management School, and Alan Gelb is Senior Fellow at the Center for Global Development.
This article is based on the authors’ IMF Working Paper 12/200, “Resource Windfalls, Optimal Public Investment, and Redistribution: The Role of Total Factor Productivity and Administrative Capacity.”

References

Arezki, Rabah, and Markus Brückner, 2011, “Oil Rents, Corruption, and State Stability: Evidence from Panel Data Regressions,” European Economic Review, Vol. 55, No. 7, pp. 955–63.
———, 2012, “Commodity Windfalls, Democracy and External Debt,” Economic Journal, Vol. 122, No. 6, pp. 848–66.
Gelb, Alan, and associates, 1988, Oil Windfalls: Blessing or Curse? (New York: World Bank/Oxford University Press).
Gelb, Alan, and Caroline Decker, 2012, “Cash at Your Fingertips: Biometric Technology for Transfers in Developing Countries,” Review of Policy Research, Vol. 29, No. 1, pp. 91–117.
Heston, Alan, Robert Summers and Bettina Aten, 2006, Penn World Table Version 6.2,Center for International Comparisons of Production, Income and Prices at the University of Pennsylvania (Philadelphia).
Kenny, Charles, and Jonathan Karver, 2012, “Publish What You Buy: The Case for Routine Publication of Government Contracts,” CGD Policy Paper 011 (Washington: Center for Global Development).
Kyobe, Annette J., Jim Brumby, Zac Mills, Era Dabla-Norris, and Chris Papageorgiou, 2011, “Investing in Public Investment: An Index of Public Investment Efficiency,” IMF Working Paper 11/37 (Washington: International Monetary Fund).
Moss, Todd, 2011, “Oil to Cash: Fighting the Resource Curse through Cash Transfers,” CGD Working Paper 237 (Washington: Center for Global Development).
Ross, Michael L., forthcoming, “The Political Economy of Petroleum Wealth in Low-Income Countries: Some Policy Alternatives,” in Commodity Prices and Inclusive Growth in Low-Income Countries, ed. by Rabah Arezki, Catherine Pattillo, Marc Quintyn, and Min Zhu (Washington: International Monetary Fund).
Sala-i-Martin, Xavier, and Arvind Subramanian, 2003, “Addressing the Natural Resource Curse: An Illustration from Nigeria,” IMF Working Paper 03/139 (Washington: International Monetary Fund).
World Bank, 2006, Where Is the Wealth of Nations? (Washington).
———, 2011, World Development Indicators (Washington).

Tuesday 11 December 2012

Unitary taxation one way to tackle multinationals


Unitary taxation one way to tackle multinationals


KATIE WALSH
Members of the federal government’s latest tax review say there are no easy answers to the global phenomenon of multinationals paying little tax, and a solution could take years.
Assistant Treasurer David Bradbury appointed the 14 members of the panel on Monday, part of his offensive against multinationals – including Google and Apple – that do not pay their “fair share” of tax.
“To address this problem is going to require a long and sustained effort,” said the Tax Justice Network’s Mark Zirnsak, one of the 14 members of the tax panel.
“I don’t have ­expectations that we’ll do work over the next year and all of a sudden this problem of companies shifting profits across borders is going to be fixed.”
Dr Zirnsak will argue for a switch to unitary taxation: allocating global profits of a business based on their economic presence in each country – the number of staff, physical assets and sales made.
“[It] makes it harder for a company to set up a headquarters in Bermuda and say all the profits are made in Bermuda,” said Dr Zirnsak, who is also Uniting Church director of the justice and international mission.
The Tax Justice Network – whose Australian members include unions and charities – released its blueprint for such a global tax model on Sunday, calling on the OECD to abandon outdated transfer pricing methods that apportion tax based on arm’s length transactions.
A similar system operates in the United States, between the states.
He said he would also table ideas to increase exchanges of information between countries and introduce whistleblowing laws to help staff to dob in tax-evading companies.
Fellow panellist Clayton Utz partner Niv Tadmore said that the group could explore an option to charge a withholding tax on sales made in Australia, where companies could lodge final year-end returns.
Corporate Tax Association executive director Frank Drenth said that a withholding tax would probably be passed on to consumers and businesses. Another option was a minimum tax, like that in the US which applies to companies that report tax income dramatically lower than their accounting income.
But unlike in the US, there were few “rorts and concessions” left in Australia that needed a minimum tax fix, Mr Drenth said.
The panel’s response might involve a mix of measures, he said, including longer-term bilateral agreements. “I’ve genuinely got an open mind on it, but we’d want any solution to be practical and workable rather than just ­theoretical,” he said.
Digital companies like Google that are causing governments around the globe grief over lost revenue are not on the panel. But their advisers are, says panellist Tim Lyons, Australian Council of Trade Unions assistant secretary. That includes partners from PwC, Deloitte, Ernst & Young and Clayton Utz.
Mr Lyons applauded the wide selection of people on the panel and said it was important to have an open mind.
“Short term fixes are okay in one sense, but the issues of the potential for there to be profitable arbitrage are not going away,” he said.
“What I’m interested in contributing to is something where we actually get our domestic settings right, and hopefully we have a few allies overseas [for a longer-term solution],” he said.
Low tax-paying multinationals are facing heat worldwide. Last week, Starbucks announced it would voluntarily pay £20 million ($30 million) in tax, as protesters prepared UK-wide action.
“It reminds me of [US presidential candidate] Mitt Romney offering to pay a little bit more tax so that his underlying rate looked a bit better,” said Mr Lyons. “Tax isn’t charity. The fact that you’ve got somebody saying ‘I’m going to volunteer to pay more tax’ shows you there’s something wrong with the tax system.”
Mr Drenth said Starbucks’ move was unprecedented on the tax front, but was in some ways similar to payments made by mining companies to aggrieved landholders.
Members of the specialist reference group:
■ Rob Heferen (Chairman), Executive Director, Revenue Group, The Treasury
■ Michael Bersten, Partner, PwC
■ Michael D’Ascenzo AO Commissioner of Taxation (2006 – 2012)
■ Frank Drenth, Executive Director, Corporate Tax Association of Australia
■ Serena Lillywhite, Mining Advocacy Coordinator, OxFam Australia
■ Ross Lyons, General Manager – Tax, Asia Pacific, Rio Tinto
■ Tim Lyons, Assistant Secretary, ACTU
■ Peter Madden, Partner, Deloitte
■ Jason Sharman, Director, Centre for Governance and Public Policy, Griffith University
■ Greg Smith, Adjunct Professor, Australian Catholic University, Senior Fellow, The Melbourne Law Masters
■ Tony Stolarek, Partner, Ernst & Young
■ Niv Tadmore, Partner, Clayton Utz
■ Brian Wilson, Chairman, Foreign Investment Review Board
■ Mark Zirnsak, Director, Justice and International Mission Unit, Uniting Church
The Australian Financial Review

Monday 10 December 2012

Google Revenues Sheltered in No-Tax Bermuda Soar to $10 Billion

Google Revenues Sheltered in No-Tax Bermuda Soar to $10 Billion


Google Inc. (GOOG) avoided about $2 billion in worldwide income taxes in 2011 by shifting $9.8 billion in revenues into a Bermuda shell company, almost double the total from three years before, filings show.
By legally funneling profits from overseas subsidiaries into Bermuda, which doesn’t have a corporate income tax, Google cut its overall tax rate almost in half. The amount moved to Bermuda is equivalent to about 80 percent of Google’s total pretax profit in 2011.
Google Inc. logos are displayed for a photograph. Photographer: Andrew Harrer/Bloomberg
The increase in Google’s revenues routed to Bermuda, disclosed in a Nov. 21 filing by a subsidiary in the Netherlands, could fuel the outrage spreading across Europe and in the U.S. over corporate tax dodging. Governments in France, the U.K.,Italy and Australia are probing Google’s tax avoidance as they seek to boost revenue during economic doldrums.
Last week, the European Union’s executive body, the European Commission, advised member states to create blacklists of tax havens and adopt anti-abuse rules. Tax evasion and avoidance, which cost the EU 1 trillion euros ($1.3 trillion) a year, are “scandalous” and “an attack on the fundamental principle of fairness,” Algirdas Semeta, the EC’s commissioner for taxation, said at a press conference in Brussels.

‘Deep Embarrassment’

“The tax strategy of Google and other multinationals is a deep embarrassment to governments around Europe,” said Richard Murphy, an accountant and director of Tax Research LLP in Norfolk, England. “The political awareness now being created in the U.K., and to a lesser degree elsewhere in Europe, is: It’s us or them. People understand that if Google doesn’t pay, somebody else has to pay or services get cut.”
Google said it complies with all tax rules, and its investment in various European countries helps their economies. In the U.K., “we also employ over 2,000 people, help hundreds of thousands of businesses to grow online, and invest millions supporting new tech businesses in East London,” the Mountain View, California-based company said in a statement.
The Internet search giant has avoided billions of dollars in income taxes around the world using a pair of tax shelter strategies known as the Double Irish and Dutch Sandwich, Bloomberg News reported in 2010. The tactics, permitted under tax law in the U.S. and elsewhere, move royalty payments from subsidiaries in Ireland and the Netherlands to a Bermuda unit headquartered in a local law firm.
Last year, Google reported a tax rate of just 3.2 percent on the profit it said was earned overseas, even as most of its foreign sales were in European countries with corporate income tax rates ranging from 26 percent to 34 percent.

Foreign Taxes

At a hearing last month in the U.K., members of Parliament pressed executives from Google, Seattle-based Amazon.com Inc. (AMZN) and Starbucks Corp. (SBUX) to explain why they don’t pay more taxes there.
The U.K., Google’s second-biggest market, was responsible for about 11 percent of its sales, or almost $4.1 billion last year, according to company filings. Google paid 6 million pounds ($9.6 million) in U.K. income taxes.
Matt Brittin, Google’s vice president for Northern and Central Europe, testified that the company pays taxes where it creates “economic value,” primarily the U.S.
Still, Google attributes some profit based on technology created in the U.S. to offshore subsidiaries, lowering its U.S. taxes, according to company filings and people familiar with its tax planning. Google paid $1.5 billion in income taxes worldwide in 2011.

‘Fair Share’

In the wake of the parliamentary hearing, the House of Commons issued a report last week declaring that multinationals “do not pay their fair share” of tax. The committee also criticized the U.K.’s tax collection agency, Her Majesty’s Revenue & Customs, for “not taking sufficiently aggressive action” and called on the agency to “get a grip” on corporate tax avoidance.
A spokesman for HMRC said the agency “ensures that multinationals pay the tax due in accordance with U.K. tax law.”
The French tax authority this year proposed increasing Google’s income taxes by about $1.3 billion. The agency searched Google’s Paris offices in June 2011 and removed computer files as part of an examination first reported by Bloomberg last year. Google is cooperating with French authorities and works with them “to answer all their questions on Google France and our service,” the company said.

Italian Audit

In Italy, the Tax Police began an audit of Google last month and recently searched the company’s Milan offices, as well as the offices of Facebook Inc. (FB), according to a person familiar with the matter. “It’s very common for companies to be audited, and we have been working closely with the Italian authorities for some time,” Google said. “So far we have not had any demands for additional tax in Italy.”
Facebook, based in Menlo Park, California, is cooperating with the Italian tax authority and “we take our obligations under the Italian tax code very seriously,” a company spokeswoman said.
In Australia, the country’s assistant treasurer gave a speech last month outlining Google’s tax avoidance strategies.
The use of offshore shelters to avoid corporate taxes has prompted calls for reform in the U.S. as well. The Treasury Department has repeatedly proposed since 2009, with little success, to make it harder for multinationals to bypass taxes by shifting profit into tax havens.

Transfer Pricing

Multinational companies cut their tax bills using “transfer pricing,” paper transactions among corporate subsidiaries that allow for allocating income to tax havens and expenses to higher-tax countries.
In Google’s case, an Irish subsidiary collects revenues from ads sold in countries like the U.K. and France. That Irish unit in turn pays royalties to another Irish subsidiary, whose legal residence for tax purposes is in Bermuda.
The pair of Irish units gives rise to the nickname “Double Irish.” To avoid an Irish withholding tax, Google channeled the payments to Bermuda through a subsidiary in the Netherlands -- thus the “Dutch Sandwich” label. The Netherlands subsidiary has no employees.
The Dutch unit’s payments to the Bermuda entity last year were up 81 percent to $9.8 billion from $5.4 billion in 2008. Google’s overseas sales have increased at about the same rate.
Google’s overall effective tax rate dropped to 21 percent last year from about 28 percent in 2008. That compares with the average combined U.S. and state statutory rate of about 39 percent.
To contact the reporter on this story: Jesse Drucker in Rome at jdrucker4@bloomberg.net
To contact the editor responsible for this story: Daniel Golden in Boston atdlgolden@bloomberg.net